Heart-rate drift is the slow change in cardiovascular response during a steady ride. You hold roughly the same power, but heart rate rises, or the power you produce at the same heart rate falls. Coaches use aerobic decoupling for the separation between external work and internal cost.
It is a useful trend, not a pass-or-fail score. Heat, dehydration, pacing noise, poor sleep, sensor errors, and a room without airflow can all make the second half look worse. The value comes from repeating the same test and comparing the pattern with the rest of your training.
Quick answer: compare the first and second halves of a steady ride
Choose a steady endurance power, keep cadence reasonably consistent, and ride long enough for the cardiovascular response to settle. Compare the power-to-heart-rate relationship in the first half with the second half. A larger separation suggests that the effort became more expensive over time, but it does not identify one single cause.
Do not use a universal threshold as a diagnosis of fitness. Different apps calculate decoupling differently, short rides are noisy, and research is still exploring how cardiovascular drift behaves across athletes and conditions.
| Signal | What it can tell you | What it cannot prove |
|---|---|---|
| HR rises at steady power | The internal cost increased | That the aerobic system alone caused it |
| Power falls at steady HR | Durability or pacing may be limited | That you need more intensity |
| Power-to-HR stays stable | The effort remained comparatively steady | That you are fully recovered |
| Large drift only in heat | Cooling may be the limiter | That baseline fitness declined |
What aerobic decoupling actually means
Think of the metric as efficiency: how much power you produce for each heartbeat. If you hold 180 watts at 140 beats per minute early and 180 watts at 150 later, the power-to-heart-rate relationship changed. Some platforms express this as a percentage; others use heart-rate drift or cardiac drift.
The calculation is meaningful only when the ride is steady enough to compare. Surges, virtual hills, pauses, cadence changes, and a bad heart-rate signal can overwhelm the slow trend you are trying to see.
Aerobic decoupling is a measurement of a ride response, not a direct measurement of mitochondrial fitness, health, or race readiness.
A repeatable indoor drift test
- 1
Choose a stable target
Use an easy-to-moderate endurance power you can hold for 45 to 75 minutes without surging. A conservative target is better than a heroic one.
- 2
Standardize the room
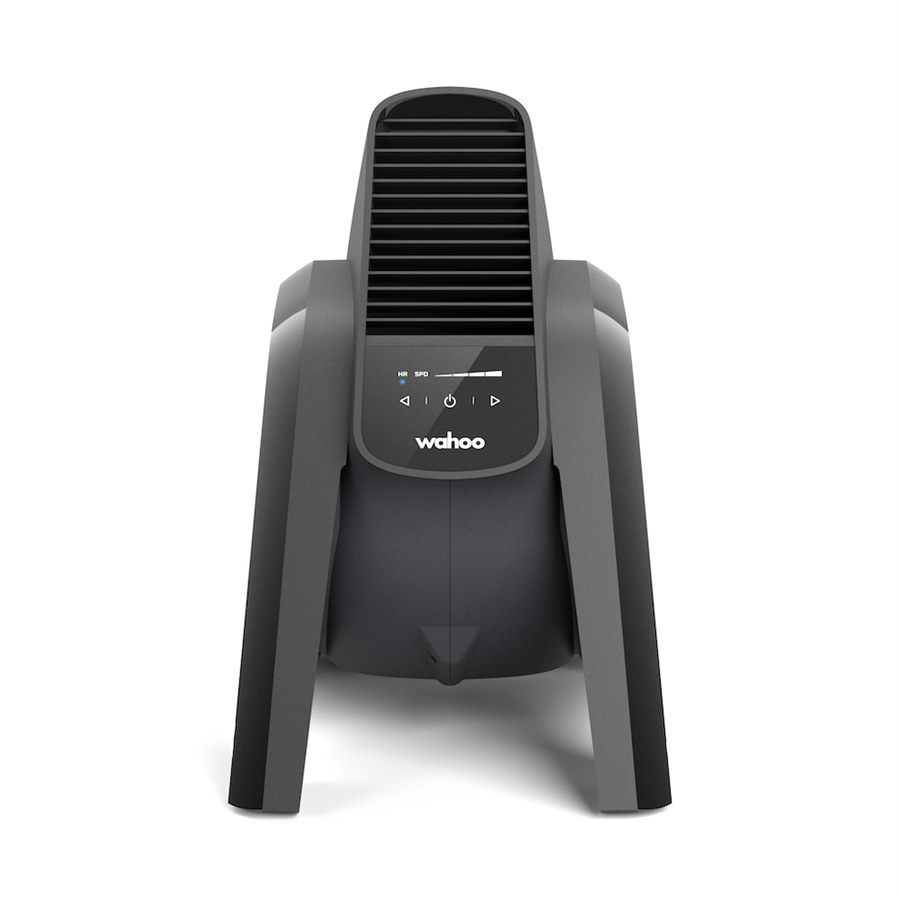
Use the same fan position, approximate room temperature, hydration plan, trainer, and sensor setup each time. Record anything that changed.
- 3
Ride continuously
Warm up, then hold the target as steadily as possible. Avoid virtual routes that force repeated accelerations or descents.
- 4
Split and compare
Compare average power and average heart rate for the first and second halves. A power-to-heart-rate ratio can be useful, but use the same calculation each time.
- 5
Log context
Write down sleep, fatigue, caffeine, food, room heat, fan setup, and perceived effort. The note often explains the result better than the percentage.
How to interpret the result
A stable relationship across the ride is encouraging evidence that the chosen endurance effort was controlled under those conditions. A rising heart rate can still be normal, especially as the room warms. A large change that repeats in cool, well-hydrated conditions may suggest that the effort is too close to your limit or that aerobic durability needs more easy volume.
Look for trends over several comparable rides. One hot session does not prove detraining. One perfect session does not prove that your base is complete. Ask whether the same power becomes more stable over time, not whether you can force a particular number today.
| Repeated pattern | Investigate first |
|---|---|
| Drift rises with room temperature | Fan position, airflow, clothing, and hydration |
| Drift rises after hard blocks | Recovery, sleep, and whether easy days are easy |
| Drift appears at every target | Sensor quality, target too high, or symptoms |
| Drift falls as weeks pass | Improved durability, better cooling, or both |
Why heart rate drifts indoors
The most common indoor cause is heat. As your body moves heat to the skin, cardiovascular demand can rise even when the trainer target does not. Dehydration, fatigue, caffeine, stress, and illness can push the response in the same direction.
The target itself matters. A ride near the top of your endurance range can look like a drift problem when it is actually a pacing problem. If the target is above what you can sustain aerobically for the intended duration, a more complicated formula will not fix the fade.
- Poor cooling or a fan that only moves air around your legs.
- Starting too hard and calling the first half an endurance baseline.
- Dehydration, insufficient food, alcohol the night before, or poor sleep.
- Heart-rate strap dropout, cadence changes, or inconsistent trainer power.
- Accumulated fatigue from turning every week into a medium-hard week.
How to improve aerobic durability
Build the ability to hold easy power by accumulating consistent easy time, not by making every endurance ride harder. Keep the target genuinely aerobic, improve cooling, and extend duration gradually. One longer controlled ride is often more informative than several short rides that finish before drift appears.
Include enough recovery to absorb the work. If data shows drift after hard sessions but not after rest, the immediate fix may be spacing and sleep rather than another interval workout. If the relationship is poor even when rested and cool, reduce the target and rebuild.
- Use a large fan aimed at your torso and ventilate the room.
- Fuel and drink consistently on longer indoor rides.
- Keep most weekly riding easy enough to recover from.
- Add time in small steps and repeat the same test every few weeks.
- Review power, heart rate, cadence, temperature, and perceived effort together.
Use drift alongside other metrics
Pair aerobic decoupling with resting heart-rate trends, sleep, subjective fatigue, and workout repeatability. A stable drift result with declining interval power is not a clean green light. A large result during a heat wave with normal performance elsewhere is not proof that your base disappeared.
Data is useful when it changes a decision. If the room is too hot, move the fan. If the effort is too high, lower the target. If the result repeatedly conflicts with how you feel or you have unusual symptoms, stop interpreting charts and get qualified advice.
If exercise repeatedly causes chest pain, faintness, severe breathlessness, palpitations, or an unusual heart-rate response, stop and seek appropriate medical care.
Key takeaways
- Aerobic decoupling compares external work with internal cardiovascular cost over a steady ride.
- Standardize the room, target, sensors, and calculation before comparing results.
- Heat and hydration are major indoor confounders; cooling is part of the test protocol.
- Look for repeated trends rather than a magic cutoff from one session.
- Use the result to adjust cooling, pacing, recovery, or consistency - not to justify more intensity automatically.
FAQ
There is no single cutoff valid across every rider, app, duration, temperature, and calculation method. Use a consistent method and look for your trend under comparable conditions.
Sources and further reading
Primary research, public guidance, and product documentation used to check the claims in this guide.
- Quantifying Training Response via Cardiovascular DriftPubMed
- Cardiovascular Drift, Cadence Decline, and Aerobic DecouplingNational Library of Medicine
- Protocol for Measuring Cardiovascular Drift During ExerciseBMJ Open Sport & Exercise Medicine